ML
回归


fit <- lm(weight ~ height, data=women)
print(fit)
## Coefficients:
## (Intercept)       height
##      -87.52         3.45
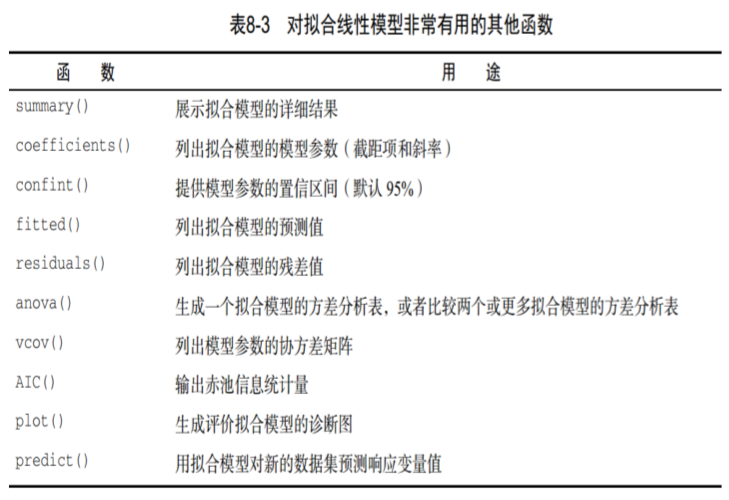
# 查看拟合模型的详细结果
summary(fit)
# 列出模型参数
coefficients(fit)
## (Intercept)      height
##  -87.51667     3.45000
# 查看结构
# 提供模型的置信区间(默认95%)
confint(fit)
##                   2.5 %     97.5 %
## (Intercept) -100.342655 -74.690679
## height         3.253112   3.646888
# 从上述结果可以发现,coefficients(fit)的数据即它们的均值
structure(fit)
## Call:
## lm(formula = weight ~ height, data = women)

## Coefficients:
## (Intercept)       height
##      -87.52         3.45

# 列出拟合模型在训练集上的预测值
fitted(fit)
# 列出拟合模型在训练集上的残差值(可以发现就是women$weight-fitted(fit)的结果)
residuals(fit)
all.equal(women$weight-fitted(fit), residuals(fit))
## [1] TRUE
# 生成拟合模型的方差统计表
anova(fit)
Analysis of Variance Table

Response: weight
          Df Sum Sq Mean Sq F value    Pr(>F)
height     1 3332.7  3332.7    1433 1.091e-14 ***
Residuals 13   30.2     2.3
---
Signif. codes:
0 ‘***’ 0.001 ‘**’ 0.01 ‘*’ 0.05 ‘.’ 0.1 ‘ ’ 1
# 列出模型参数的协方差矩阵
vcov(fit)
##             (Intercept)       height
## (Intercept)   35.247305 -0.539880952
## height        -0.539881  0.008305861

# 输出赤池信息统计量
AIC(fit)
## [1] 59.08158
# 绘制散点图
plot(fit) # 一共画5张图出来

# 预测新的数据
new_height <- data.frame(height=c(66, 67, 90))
predict(fit, new_height)
##        1        2        3
## 140.1833 143.6333 222.9833
# 不能写为
predict(fit, c(66, 67, 90))
# 必须是
predict(fit, data.frame(height=c(66, 67, 90)))
# 绘制真实散点与拟合的曲线
with(women, {
    plot(height, weight) # 千万别写反了!!!不然下面那一句画出来是错的
    abline(fit)
    })
补充
在一般的情况下,AIC可以表示为:
$AIC=2k-2\ln(L)\ $, 其中:K是参数的数量,L是似然函数。
假设条件是模型的误差服从独立正态分布。
让n为观察数,RSS为残差平方和,那么AIC变为:
$AIC=2k+n\ln(RSS/n)\ $, 增加自由参数的数目提高了拟合的优良性,AIC 鼓励数据拟合的优良性但是尽量避免出现过度拟合的情况。
所以优先考虑的模型应是 AIC 值最小的那一个。赤池信息量准则的方法是寻找可以最好地解释数据但包含最少自由参数的模型。
# 多项式回归
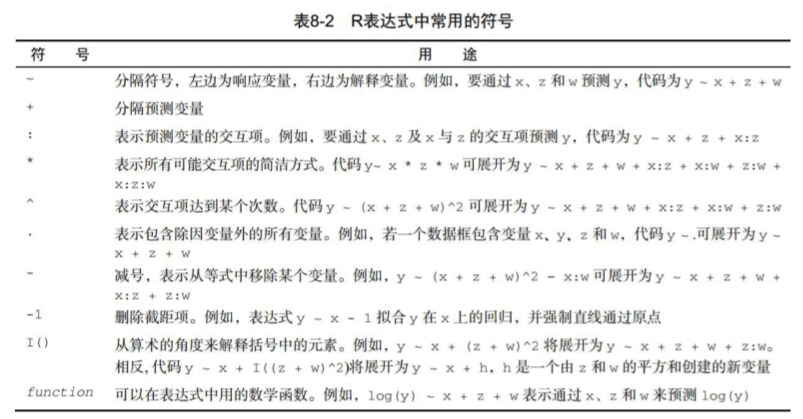
fit2 <- lm(weight~height+I(height^2), data=women)
plot(women$height, women$weight)
lines(women$height, fitted(fit2)) # 不能再用 abline,因为它只能画直线
# lines的功能是按指定次序依次连接各点
# lines(x, y, col = "red",
#      lwd = 2, lty = 1)

# 多元回归
input <- mtcars[,c("mpg", "disp", "hp", "wt")]
model <- lm(mpg~disp+hp+wt, data=input)
newdata <- data.frame(disp=c(1,2,3), hp=c(4,5,6), wt=c(7, 8, 9)) # 当然预测一个值也可以
predict(model, newdata)
- 调用:Call
lm(formula = DstValue ~ Month + RecentVal1 + RecentVal4 + RecentVal6 + RecentVal8 + RecentVal12, data = trainData)
当创建模型时,以上代码表明lm是如何被调用的。
Min 1Q Median 3Q Max -4806.5 -1549.1 -171.8 1368.7 6763.3
残差第一四分位数(1Q)和第三分位数(Q3)有大约相同的幅度,意味着有较对称的钟形分布。
- 系数:Coefficients
Estimate Std. Error t value Pr(>|t|)
(Intercept) 1.345e+06 5.659e+05 2.377 0.01879 *
Month 8.941e+02 2.072e+02 4.316 3.00e-05 ***
分别表示: 估值 标准误差 T值 P值
Intercept:表示截距
Month:影响因子/特征
- Estimate的列:包含由普通最小二乘法计算出来的估计回归系数。
- Std. Error的列:估计的回归系数的标准误差。
- P值估计系数不显著的可能性,有较大P值的变量是可以从模型中移除的候选变量。
- t 统计量和P值:从理论上说,如果一个变量的系数是0,那么该变量是无意义的,它对模型毫无贡献。然而,这里显示的系数只是估计,它们不会正好为0。因此,我们不禁会问:从统计的角度而言,真正的系数为0的可能性有多大?这是t统计量和P值的目的,在汇总中被标记为t value和Pr(>|t|)。
其 中,我们可以直接通过P值与我们预设的0.05进行比较,来判定对应的解释变量的显著性,我们检验的原假设是:该系数显著为0;若P<0.05,则拒绝原假设,即对应的变量显著不为0。可以看到Month、RecentVal4、RecentVal8都可以认为是在P为0.05的水平下显著不为0,通过显著性检验;Intercept的P值为0.26714,不显著。
- Multiple R-squared和Adjusted R-squared
这两个值,即,常称之为“拟合优度”和“修正的拟合优度”,指回归方程对样本的拟合程度几何,这里我们可以看到,修正的拟合优 度=0.8416,表示拟合程度良好,这个值当然是越高越好。当然,提升拟合优度的方法很多,当达到某个程度,我们也就认为差不多了。具体还有很复杂的判定内容,有兴趣的可以看看:http://baike.baidu.com/view/657906.htm
- F-statistic
F-statistic,是我们常说的F统计量,也成为F检验,常常用于判断方程整体的显著性检验,其值越大越显著;其P值为p-value: < 2.2e-16,显然是<0.05的,可以认为方程在P=0.05的水平上还是通过显著性检验的。
简单总结:
- T检验:检验解释变量的显著性;
- R-squared:查看方程拟合程度;
- F检验:是检验方程整体显著性。
如果是一元线性回归方程,T检验的值和F检验的检验效果是一样的,对应的值也是相同的。
聚类
# 数据集准备
x <- rnorm(12, mean=rep(1:3, each=4), sd=0.2) # 前四个数均值为1,...
y <- rnorm(12, mean=rep(c(1,2,1), each=4), sd=0.2)
plot(x, y, col='blue', pch=19)
text(x+0.05, y+0.05, labels=as.character(1:12))

# 层次聚类
df <- data.frame(x=x, y=y)
dist_xy <- dist(df) # 生成 12*12的距离矩阵
hClustering <- hclust(dist_xy)
plot(hClustering)

clusterCut <- cutree(hClustering, 3)
plot(clusterCut)
clusterCut
## [1] 1 1 1 1 2 2 2 2 3 3 3 3

# kmeans
kmeans_obj <- kmeans(df, centers=3)
kmeans_obj$cluster
## [1] 3 3 3 3 1 1 1 1 2 2 2 2
plot(x, y, col=kmeans_obj$cluster)
# 添加聚类中心点
kmeans_obj$centers
          x         y
1 1.8698973 1.9759948
2 3.0178968 1.0219352
3 0.8679608 0.7257395
points(kmeans_obj$centers, col=1:3, pch=3, cex=3, lwd=3) # 用 plot 也可以,而且不用在"画过的"上面
分类
逻辑回归
train <- sample(nrow(df), 0.7*nrow(df)) # 7:3比
df.train <- df[train, ] # 动态添加成员
df.validate <- df[-train, ]

# 逻辑回归
fit.logit <- glm(Class~., data=df.train, family=binomial(), control=list(maxit=100))
# 查看结果
summary(fit.logit)
# 预测
prob <- predict(fit.logit, df.validate, type="response")
# 概率大于0.5的判定为malignant
logit.pred <- factor(prob > .5, levels=c(F, T), labels=c("benign", "malignant"))

# 计算分类混淆矩阵
logit.perf <- table(df.validate$Class, logit.pred, dnn=c("Actual", "Predicted"))
type: Response gives you the numerical result while class gives you the label assigned to that value.
决策树
library(rpart)
set.seed(1234)
# 生成决策树s
dtree <- rpart(Class~., data=df.train, method="class", parms=list(split="information"))
# 绘制决策树
library(rpart.plot)
prp(dtree, type=4, extra=104, fallen.leaves=T, main='DT')
# main 指标题

# 预测
dtree.pred <- predict(dtree, df.validate, type='class')

# 混淆矩阵
dtree.perf <- table(df.validate$Class, dtree.pred, dnn=c("Actual", "Predicted"))
rpart()参数解释
method
one of "anova", "poisson", "class" or "exp". If method is missing then the routine tries to make an intelligent guess. If y is a survival object, then method = "exp" is assumed, if y has 2 columns then method = "poisson" is assumed, if y is a factor then method = "class" is assumed, otherwise method = "anova" is assumed. It is wisest to specify the method directly, especially as more criteria may added to the function in future.
Alternatively, method can be a list of functions named init, split and eval. Examples are given in the file tests/usersplits.R in the sources, and in the vignettes ‘User Written Split Functions’.
parms
optional parameters for the splitting function. Anova splitting has no parameters. Poisson splitting has a single parameter, the coefficient of variation of the prior distribution on the rates. The default value is 1. Exponential splitting has the same parameter as Poisson. For classification splitting, the list can contain any of: the vector of prior probabilities (component prior), the loss matrix (component loss) or the splitting index (component split). The priors must be positive and sum to 1. The loss matrix must have zeros on the diagonal and positive off-diagonal elements. The splitting index can be gini or information. The default priors are proportional to the data counts, the losses default to 1, and the split defaults to gini.
prp()参数解释
type
Type of plot. Possible values:
0 Default. Draw a split label at each split and a node label at each leaf.
1 Label all nodes, not just leaves. Similar to text.rpart's all=TRUE.
2 Like 1 but draw the split labels below the node labels. Similar to the plots in the CART book.
3 Draw separate split labels for the left and right directions.
4 Like 3 but label all nodes, not just leaves. Similar to text.rpart's fancy=TRUE. See also clip.right.labs.
5 Show the split variable name in the interior nodes.
extra
Display extra information at the nodes. Possible values:
"auto" (case insensitive) Automatically select a value based on the model type, as follows: extra=106 class model with a binary response extra=104 class model with a response having more than two levels extra=100 other models
0 Default. No extra information.
1 Display the number of observations that fall in the node (per class for class objects; prefixed by the number of events for poisson and exp models). Similar to text.rpart's use.n=TRUE.
2 Class models: display the classification rate at the node, expressed as the number of correct classifications and the number of observations in the node. Poisson and exp models: display the number of events.
3 Class models: misclassification rate at the node, expressed as the number of incorrect classifications and the number of observations in the node.
4 Class models: probability per class of observations in the node (conditioned on the node, sum across a node is 1).
5 Class models: like 4 but don't display the fitted class.
6 Class models: the probability of the second class only. Useful for binary responses.
7 Class models: like 6 but don't display the fitted class.
8 Class models: the probability of the fitted class.
9 Class models: The probability relative to all observations -- the sum of these probabilities across all leaves is 1. This is in contrast to the options above, which give the probability relative to observations falling in the node -- the sum of the probabilities across the node is 1.
10 Class models: Like 9 but display the probability of the second class only. Useful for binary responses.
11 Class models: Like 10 but don't display the fitted class.
+100 Add 100 to any of the above to also display the percentage of observations in the node. For example extra=101 displays the number and percentage of observations in the node. Actually, it's a weighted percentage using the weights passed to rpart.
Note: Unlike text.rpart, by default prp uses its own routine for generating node labels (not the function attached to the object). See the node.fun argument.
fallen.leaves
Default FALSE. If TRUE, position the leaf nodes at the bottom of the graph.
随机森林
library(randomForest)
fit.forest <- randomForest(Class~., data=df.train, importance=TRUE)
# 查看训练情况
fit.forest
# 查看每个特征的重要性
importance(fit.forest, type=2)
                MeanDecreaseGini
Cl.thickness            7.169865
Cell.size              58.851794
Cell.shape             59.590685
Marg.adhesion           4.719127
Epith.c.size           21.029246
Bare.nuclei            39.524843
Bl.cromatin            16.365516
Normal.nucleoli        14.680208
Mitoses                 1.153233


# 预测
forest.pred <- predict(fit.forest, df.validate)
forest.perf <- table(df.validate$Class, forest.pred)
randomForest()
importance
Should importance of predictors be assessed?
importance()
type
either 1 or 2, specifying the type of importance measure (1=mean decrease in accuracy, 2=mean decrease in node impurity).
- Mean Decrease Accuracy - How much the model accuracy decreases if we drop that variable.
- Mean Decrease Gini - Measure of variable importance based on the Gini impurity index used for the calculation of splits in trees.
Higher the value of mean decrease accuracy or mean decrease gini score , higher the importance of the variable in the model.
支持向量机
library(e1071)
fit.svm <- svm(Class~., data=df.train)
# 查看
fit.svm
# 预测
svm.pred <- predict(fit.svm, df.validate)
svm.perf <- table(df.validate$Class, svm.pred)
神经网络
library(nnet)
# 生成label的one hot矩阵
train_target_class<-class.ind(df.train$Class)
validate_target_class<-class.ind(df.validate$Class)

# [,-10]是除去label所在的那一列作为输入
# X: df.train[,-10]
# y: train_target_class
# 隐藏层神经元个数:20
myann <- nnet(df.train[,-10], train_target_class, size=20, softmax=TRUE)
# 预测
test_label <- predict(myann, df.validate[,-10], type="class")
my_table <- table(df.validate$Class, test_label)

# 计算错误率
test_error <- 1-sum(diag(my_table))/sum(my_table)