Plot
画图基础
1. 窗口与输出
# 保存到pdf
pdf('fname.pdf')
...
dev.off()

# 在新的窗口创建一幅新的图像
dev.new()
...
dev.new()
...
2. 例子
dose <- c(20,30,40,45,60)
drugA <- c(16,20,27,40,60)
drugB <- c(15,18,25,31,40)
plot(dose, drugA, type='b') # (dose,drugA) 用线段连接
# type='b'表示同时绘制点和线 没有指定的话画出来是散点 具体的选项见P251
3. 图形参数
# 利用par()指定参数,除非被再次修改,否则在会话结束前一直有效
opar <- par(no.readonly = T) # 拷贝原来的参数
par(lty=2, pch=17) # 指定新的参数
plot(dose, drugA, type='b')
par(opar) # 还原参数

# 可以随便使用par()
# 如上式可以写成
# par(lty=2) # 虚线连接
# par(pch=17)# 实心三角

# 也可以在plot内指定, 指定的选项仅对这幅图本身有效
# plot(dose, drugA, type='b', lty=2, pch=17)

# 使用 dev.off() 恢复默认设置
3. 1 常见符号和线条


3. 2 颜色

在R中,可以通过颜色下标,颜色名称,十六进制颜色值,RGB值或HSV值指定
例如:col=1 col="white" col="#FFFFFF" col=rgb(1,1,1) col=hsv(0,0,1) 都是白色
colors()可以返回所有可用颜色的名称
创建连续型颜色向量的函数:rainbow() heat.Colors() terrain.colors() topo.colors() cm.colors() 例如,rainbow(10) 可以生产10种连续的"彩虹型"颜色
rainbow(10)
## [1] "#FF0000" "#FF9900" "#CCFF00" "#33FF00" "#00FF66" "#00FFFF" "#0066FF" "#3300FF" "#CC00FF"
## [10] "#FF0099"
3. 3 文本属性


3. 4 图形尺寸与边界

4. 其他元素
4. 1 标题

4. 2 坐标轴
plot(..., xlim=c(0, 60), ylim=c(0,60) 指定坐标轴取值区间
axis(side, at=, labels= , pos= , lty= , col= , las= , tck= , ...)

4. 3 参考线
abline(h=yvalues, v=xvalues)
dose <- c(20,30,40,45,60)
drugA <- c(16,20,27,40,60)
drugB <- c(15,18,25,31,40)
plot(dose, drugA, type='b')
abline(h=c(20,30)) # 画y=20 y=30 三条水平线
abline(h=c(20,30), v=c(40,50,60)) # 画y=10 y=20 y=30 三条水平线 以及 x=40 x=50 x=60 三条垂直线
4. 4 图例
legend(location, title, legend, ...)


4. 5 文本标注
text(location, "text to place", pos, ...):绘图区域内添加文本
mtext("text to place", side, line=n, ...:图形的四个边界之一添加文本


4. 6 数学标注
text()中的字符串代替成expression(f(x)==sqrt(x))
5. 图形的组合
par(mfrow=c(2,2))指定后,每次plot会依次在指定位置画图
par(mfcow=c(2,2)) 按列填充
layout()用法

par(fig=c(x1,x2,y1,y2)):在 x1~x2 y1~y2 的区域内画图(x1
x2 y1 y2 取值范围为 0~1)
基础图形
1. 条形图
barplot(height, [names.org=...])
height必须是向量或矩阵(此时画堆叠图或分组图,具体哪一种由beside指定)names指定每一个柱块的名字,若 height 已经是类似series,则无需
count <- table(Arthritis$Improved)
##  None   Some Marked
##    42     14     28

# 简单条形图
barplot(count,
        main='Simple Bar Plot',
        xlab='Improvement', ylab='Freq')
# 水平条形图
barplot(count,
        main='Horizontal Bar Plot',
        xlab='Freq', ylab='Improvement',
        horiz=T)

# 事实上,若要绘制的类别型变量是一个因子或有序型因子,就可以用plot()直接画条形图,且无需table()
plot(Arthritis$Improved, main="Simple Bar Plot", xlab="...", ylab='...')
plot(Arthritis$Improved, main="Simple Bar Plot", xlab="...", ylab='...', horiz=T)

# 堆叠条形图
counts <- table(Arthritis$Improved, Arthritis$Treatment)
##         Placebo Treated
##  None        29      13
##  Some         7       7
##  Marked       7      21
barplot(counts, main='Stacked Bar Plot',
        xlab='Treatment', ylab='Freq',
        col=c("red", "yellow", "green"),
        legend=rownames(counts))
# 画出来效果就相当于那个矩阵的排列,第一列有三块,长度是29 7 7(顺序不一定),...

# 分组条形图
barplot(counts, main='Grouped Bar Plot',
        xlab='Treatment', ylab='Freq',
        col=c("red", "yellow", "green"),
        legend=rownames(counts),
        beside=T)
# count中竖着的是一组

# 棘状图 宽度表示样本量的相对大小
spine(counts, main='Spine')

# 排序后画图
aggregate(mtcars, by=list(cyl, gear), FUN=mean, na.rm=TRUE)
# group by(cyl, gear) and apply mean on each group
states <- data.frame(state.region, state.x77)
##                 state.region Population Income Illiteracy Life.Exp Murder HS.Grad Frost   Area
## Alabama                South       3615   3624        2.1    69.05   15.1    41.3    20  50708
## Alaska                  West        365   6315        1.5    69.31   11.3    66.7   152 566432
## Arizona                 West       2212   4530        1.8    70.55    7.8    58.1    15 113417
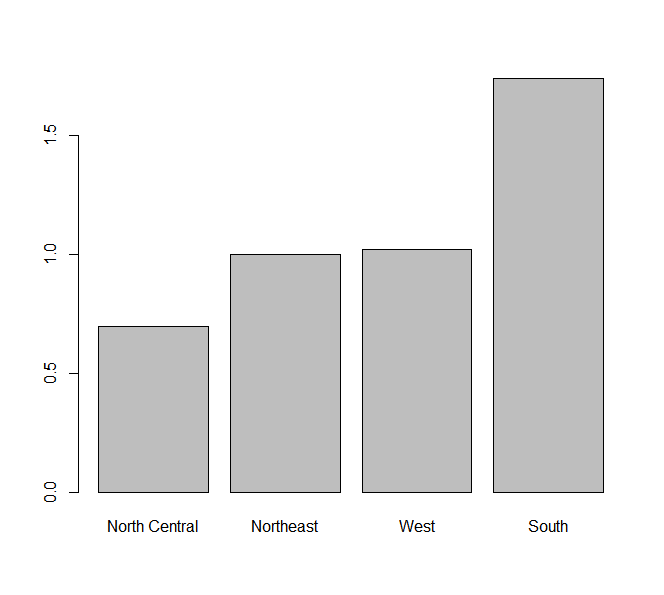
means <- aggregate(states$Illiteracy, by=list(state.region), FUN=mean)
##         Group.1        x
## 1     Northeast 1.000000
## 2         South 1.737500
## 3 North Central 0.700000
## 4          West 1.023077
means <- means[order(means$x),]
barplot(means$x, names.arg=means$Group.1)
2. 饼图
pie(x, labels)
x: 非负数值向量
# 普通pie
slices <- c(10, 12, 4, 16, 8)
labels <- c("US", "UK", "Australia", "Germany", "France")
pie(slices, labels=labels, main="Pie")

# 从table创建表
mytable <- table(state.region)
## state.region
##     Northeast         South North Central          West
##             9            16            12            13
names(mytable)
## [1] "Northeast"     "South"         "North Central"
## [4] "West"
lbl <- paste(names(mytable), "\n", mytable, sep='')
## [1] "Northeast\n9"      "South\n16"
## [3] "North Central\n12" "West\n13"
pie(mytable, labels=lbl)

# 3D
library(plotrix)
pie3D(slices, labels=labels, explode=0.1, main='Pie3D')

# 扇形图
library(plotrix)
fan.plot(slices, labels=labels, main='Fan Plot')
3. 直方图
hist(x)
x是一根向量
hist(mtcars$mpg)

# 普通
hist(mtcars$mpg, breaks=12, col='red',
     xlab='x', ylab='y', main='Hist')
# 频率直方图
hist(mtcars$mpg, freq=F, breaks=12, col='red',
     xlab='x', ylab='y', main='Hist')

# 添加密度曲线,轴须图
hist(mtcars$mpg, freq=F, breaks=12, col='red',
     xlab='x', ylab='y', main='Hist')

# 轴须图
jitter(mtcars$mpg) # 增加一些噪声
## [1] 20.99808 20.99335 22.78245 21.41227 18.68284 18.08293 14.29518 24.41251 22.79814 19.20701 17.81055 16.41208 17.30560
## [14] 15.21197 10.40166 10.39635 14.71412 32.39475 30.38034 33.91403 21.51109 15.50591 15.18278 13.28949 19.19388 27.31423
## [27] 25.99347 30.40607 15.81251 19.70084 15.00779 21.40995
rug(jitter(mtcars$mpg)) # x轴下面添加须
lines(density(mtcars$mpg), col='blue', lwd=2)

# 课本有添加边框和正态分布曲线的做法
x <- mtcars$mpg
h <- hist(mtcars$mpg, breaks=12, col='red',
     xlab='x', ylab='y', main='Hist')
> h$mids
# [1] 11 13 15 17 19 21 23 25 27 29 31 33
xfit <- seq(min(x), max(x), length=40)
yfit <- dnorm(xfit, mean=mean(x), sd=sd(x))
yfit <- yfit * diff(h$mids[1:2]) * length(x)
# diff(h$mids[1:2]) 求step
4. 核密度图
plot(density(x))
density(mtcars$mpg)
## Call:
##  density.default(x = mtcars$mpg)
## Data: mtcars$mpg (32 obs.);  Bandwidth 'bw' = 2.477
##        x               y
##  Min.   : 2.97   Min.   :6.481e-05
##  1st Qu.:12.56   1st Qu.:5.461e-03
##  Median :22.15   Median :1.926e-02
##  Mean   :22.15   Mean   :2.604e-02
##  3rd Qu.:31.74   3rd Qu.:4.530e-02
##  Max.   :41.33   Max.   :6.795e-02
d <- density(mtcars$mpg)
plot(d)
# 将曲线改为蓝色并用实心红色填充曲线下方区域
polygon(d, col='red', border='blue')
# 添加棕色轴须图
rug(mtcars$mpg, col='brown')

# 可比较的核密度图
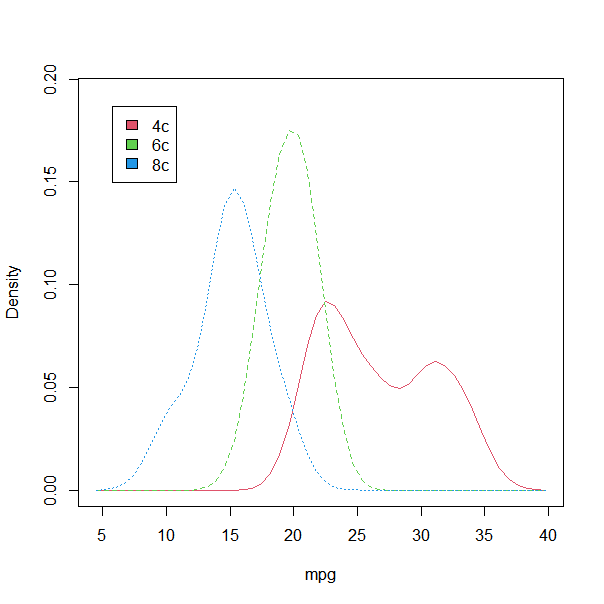
library(sm)
attach(mtcars)
cyl
## [1] 6 6 4 6 8 6 8 4 4 6 6 8 8 8 8 8 8 4 4 4 4 8 8 8 8 4 4 4 8 6 8 4
cyl.f <- factor(cyl, levels=c(4,6,8), labels=c('4c', '6c', '8c'))
cyl.f
## [1] 6c 6c 4c 6c 8c 6c 8c 4c 4c 6c 6c 8c 8c 8c 8c 8c 8c 4c 4c 4c 4c 8c 8c 8c 8c 4c 4c 4c 8c 6c
## [31] 8c 4c
## Levels: 4c 6c 8c
sm.density.compare(mpg, cyl) # 绘制密度图(分别对每一个Level绘制核密度图,最后得到三条曲线,图例就是Level内容)
colfill <- c(2:(1+length(levels(cyl.f))))
legend(locator(1), levels(cyl.f), fill=colfill) # 在鼠标点击位置添加图例
detach(mtcars)
5. 箱线图
boxplot(x)
boxplot(mtcars$mpg)

# 并列箱线图,横轴分别是cyl的level
boxplot(mpg ~ cyl, data=mtcars)

# boxplot(y~A, data=xxx) 将为无序因子型变量A的每个字并列生成y的箱线图
# boxplot(y~A*B, data=xxx) 将为无序因子型变量A和B所有level的两类组合生成...
# 添加 varwidth=T 将使箱线图的宽度与样本大小的平方根成正比
# 添加 horizontal=T 将反转坐标轴
# 添加 north=T 含凹槽的箱线图
6. 小提琴图
vioplot(x1, x2, ..., names=, col=)
library(vioplot)
x1 <- mtcars$mpg[mtcars$cyl==4]
x2 <- mtcars$mpg[mtcars$cyl==6]
x3 <- mtcars$mpg[mtcars$cyl==8]
vioplot(x1, x2, x3, names=c('4cyl', '6cyl', '8cyl'))
7. 点图
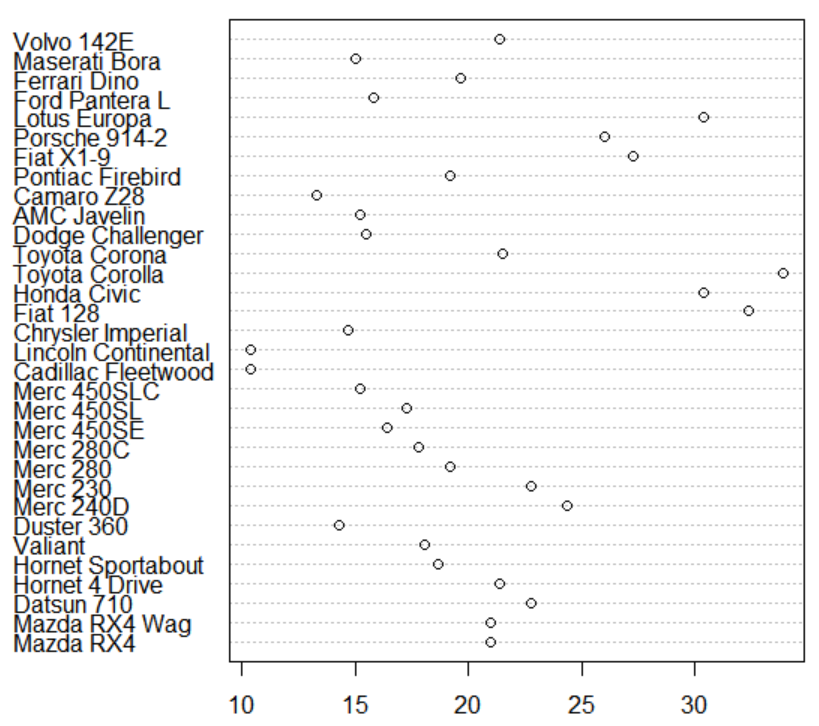
dotchart(x, labels=)
dotchart(mtcars$mpg, labels=row.names(mtcars))
# 分组后的点图
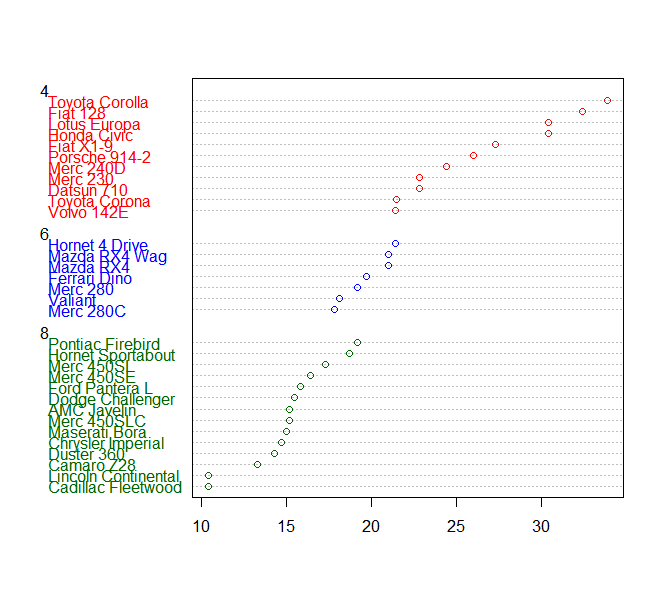
x <- mtcars[order(mtcars$mpg), ]
x$cyl <- factor(x$cyl)
x$color[x$cyl==4] <- "red"
x$color[x$cyl==6] <- "blue"
x$color[x$cyl==8] <- "darkgreen"
dotchart(x$mpg,
        labels=row.names(x),
        groups=x$cyl,
        color=x$color)
8. 散点图
# 添加最佳拟合曲线的散点图
attach(mtcars)
plot(wt, mpg)
lm(mpg~wt)
## Call:
## lm(formula = mpg ~ wt)
## Coefficients:
## (Intercept)           wt
##      37.285       -5.344
# 下面两个必须在前面已经plot的前提下才可以调用
abline(lm(mpg~wt), col='red')
lines(lowess(wt, mpg), col='blue') # 添加一条平滑

# 散点图矩阵
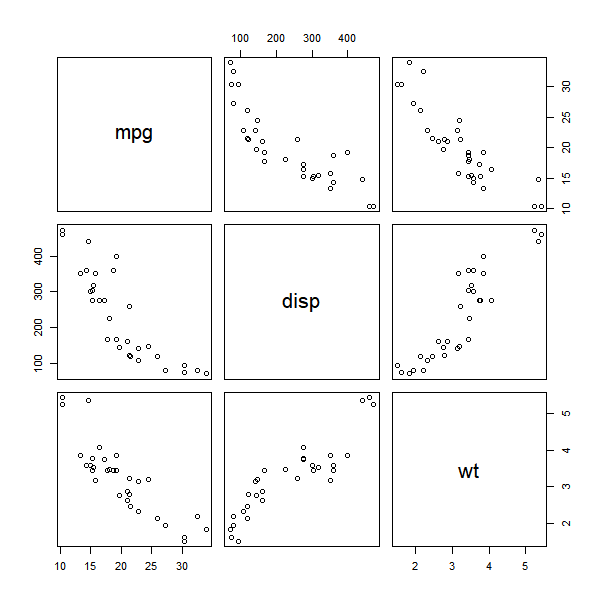
pairs(~mpg+disp+wt, data=mtcars)

# 高密度散点图
n <- 10000
c1 <- matrix(rnorm(n, mean=0, sd=.5), ncol=2)
c2 <- matrix(rnorm(n, mean=3, sd=2), ncol=2)
mydata <- rbind(c1, c2) # 按行拼接
mydata <- as.data.frame(mydata)
names(mydata) <- c('x', 'y')
# 正常散点图看不清
with(mydata,
    plot(x, y, pch=19)
)
# 要用高密度散点图
with(mydata,
    smoothScatter(x, y, main='Title')
)
# 三维散点图
# scatterplot3d包
library(scatterplot3d)
attach(mtcars)
scatterplot3d(wt, disp, mpg, main='3D')

# rgl包 可交互
library(rgl)
plot3d(wt, disp, mpg, size=3, col='red')
9. 气泡图
attach(mtcars)
r <- sqrt(disp/pi)
symbols(wt, mpg, circle=r, inches=0.3,
       fg='white', 'bg'='lightblue', main='气泡图',
       ylab='y', xlab='x')
# 在各个气泡的位置输出mtcaras的行名
text(wt, mpg, rownames(mtcars), cex=0.6)
detach(mtcars)
10. 相关图
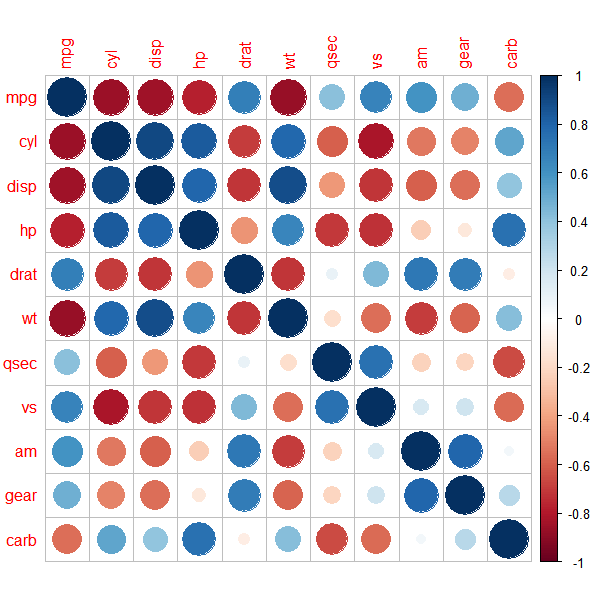
library(corrplot)
M <- cor(mtcars)
corrplot(M, method='circle')
# corrplot(M, method='circle', col=rev(c(...)))
11. 马赛克图
library(vcd)
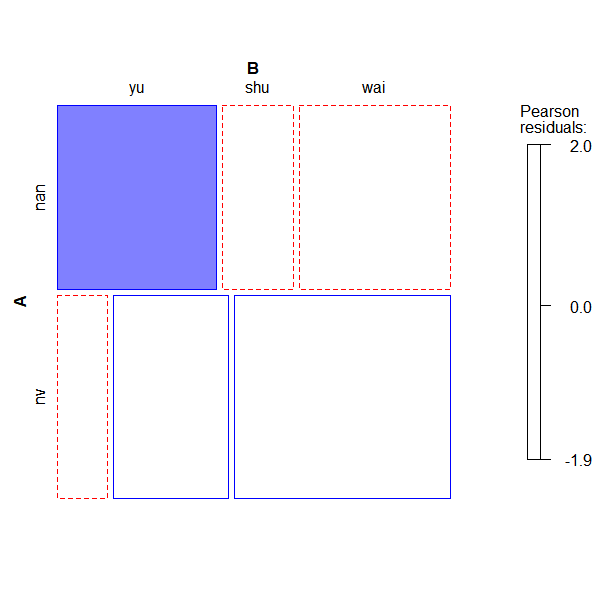
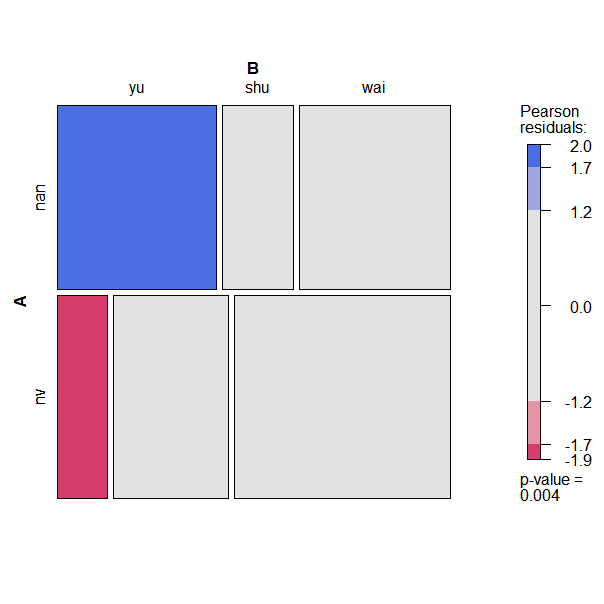
mym = matrix(c(20,7,9,16,19,30),nrow = 2)
# 表格的行名称改为'nan','nv',列名称改为'yu','shu','wai'
rownames(mym)<-c('nan','nv')
colnames(mym)<-c('yu','shu','wai') #绘制男女生和各科优秀成绩的马赛克图
##     yu shu wai
## nan 20   9  19
## nv   7  16  30
mosaic(mym, gp = shading_Friendly)
mosaic(mym, gp = shading_max)
mosaic(~Class+Sex+Age+Survived, data=Titanic, shade=T, legend=T)
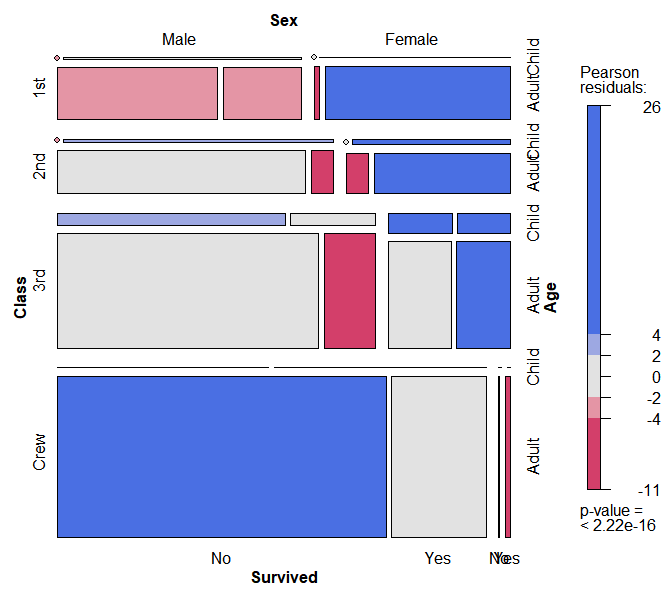
-
左上右分别是顶层,第一层,第二层
-
scale代表数据量
-
color代表拟合模型的残差值:蓝色表示,假设生存率与船舱等级、性别、年龄无关的条件下,该类别下的生存率通常超过预期值
红色相反
12. 多边形图
x <- seq(-2*pi, 2*pi, 0.1)
y <- dnorm(x)
plot(x, y) # 必须先调用
polygon(x, y)
ggplot2
1. 例子
library(ggplot2)
# 画横纵坐标轴 + 画点 + 添加文字
ggplot(data=mtcars, aes(x=wt, y=mpg)) +
geom_point() +
labs(title="Title", x="Weight", y="Mile")
# 画拟合曲线
ggplot(data=mtcars, aes(x=wt, y=mpg)) +
geom_point(pch=17, color="blue", size=2) +
geom_smooth(method="lm", color="red", linetype=2) +
labs(title="Title", x="Weight", y="Mile")
# 分组画
ggplot(data=mtcars, aes(x=hp, y=mpg, shape=cyl, color=cyl)) +
geom_point(size=3) +
facet_grid(am~vs) +
labs(title="Title", x="Weight", y="Mile")
# 根据点的种类绘制相应的颜色
g <- ggplot(iris, aes(x=Sepal.Length, y=Sepal.Width)) +
geom_point(aes(col=Species))
2. 调整元素
# 调整坐标轴范围
# 法一
# 先画图
g <- ggplot(iris, aes(x=Sepal.Length, y=Sepal.Width)) +
geom_point() +
geom_smooth(method='lm') # 这样子赋值给g的话不会显示画出,要想画出可以 plot(g)
# 眼睛观察范围外的点,然后限制范围
g + xlim(c(5, 7)) + ylim(c(2.5, 3.5))

# 法二
g <- ggplot(iris, aes(x=Sepal.Length, y=Sepal.Width)) +
geom_point() +
geom_smooth(method='lm')
g + coord_cartesian(xlim=c(5, 7), ylim=c(2.5, 3.5))

# 修改标签内容
g + labs(title='...', subtitle=',,,', x='xxx', y='yyy', caption='ccc')

# 删除图例
g + theme(legend.position='None')

# 改变整体环境配色
g + scale_colour_brewer(palette="Dark2")

# 改变坐标轴的字体和位置
# x轴标注区域为5到7标注,间隔为每隔0.2标注一个值
g + scale_x_continuous(breaks=seq(5, 7, 0.2))

# 改变坐标轴标注内容
# x轴标注间隔变为0.1 + 标注内容变为字母
g + scale_x_continuous(breaks=seq(5, 7, 0.2), labels=letters[1:21])

# 改变主题设置
g + theme_set(theme_classic())

# 添加主题层改变主题设置
g + theme_bw() + labs(subtitle='sss')
# 或
g + theme_dark() + labs(subtitle='sss')

# 给点添加标签
g + geom_text(aes(label=Species), vjust=-1, size=4, data=iris)

# 绘图区域添加注释
my_grob = grid.text(my_text, x=0.7, y=0.8, gp=gpar(col="firebrick", fontsize=14, fontface="bold"))
g + annotation_custom(my_grob)

# 子图
# 利用facet_wrap实现多组绘图, 这里iris数据集的Species包含3类, 每一类分别绘制一幅子图
g + facet_wrap( ~ Species, ncol=3)
3. 柱状图
# 不计数直接绘制
df <- data.frame(dose=c('D0.5', 'D1', 'D2'), len=c(4.2, 10, 29.5))
ggplot(data=df, aes(x=dose, y=len)) + geom_col()

# 计数后绘制
ggplot(iris, aes(Species, col="yellow", fill=Species)) + geom_bar()
4. 折线图
df <- data.frame(time=c("breakfast", "lunch", "dinner"), bill=c(10,30,15))
ggplot(data=df,aes(x=time, y=bill, group=1)) + geom_line() + geom_poi